Financials Prediction Markets

S&P close price end of 2026?
7,800 to 7,999.99 market icon
7,800 to 7,999.99
7,600 to 7,799.99 market icon
7,600 to 7,799.99
$15,354,237 vol
10Y US Treasury yield on Dec 31, 2027?
4% or above
7.25% or above
$210,246 vol
10Y US Treasury yield on Oct 22, 2026?
5.12% or above market icon
5.12% or above
5.14% or above market icon
5.14% or above
Oct 21 @ 7:30 PM
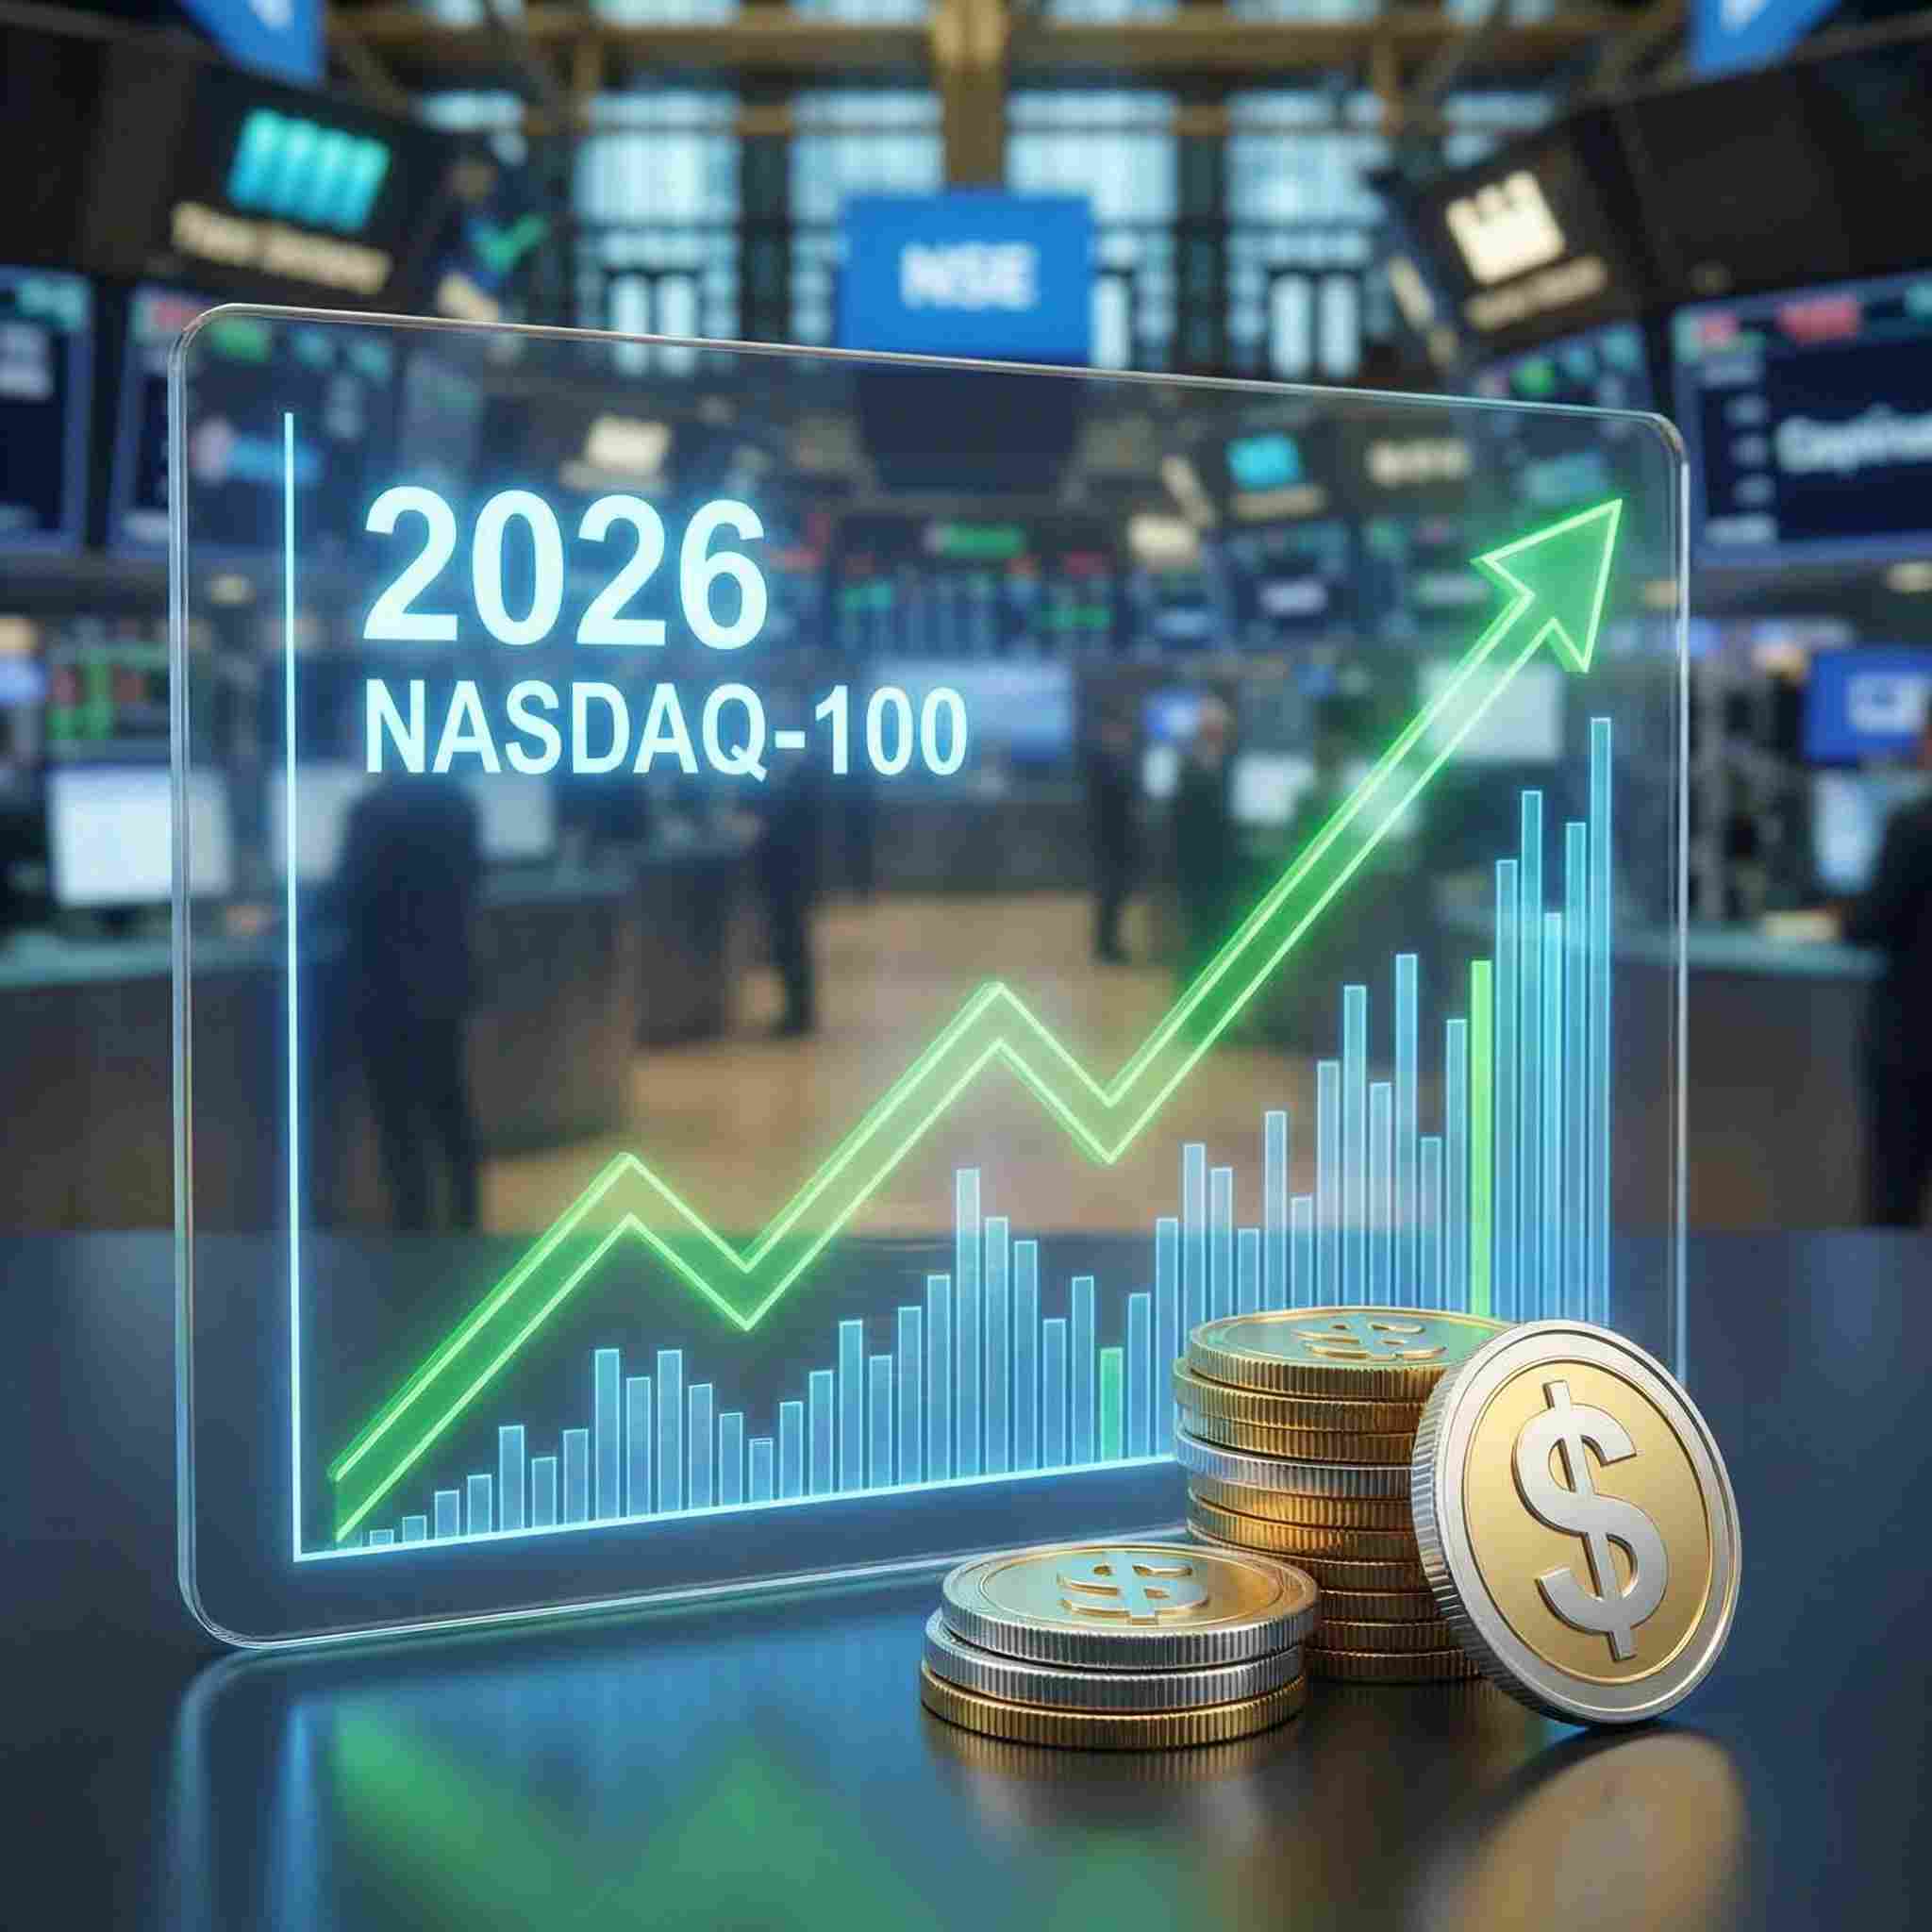
Nasdaq-100 close price end of 2026?
33,000.01 or above market icon
33,000.01 or above
30,500 to 30,999.99 market icon
30,500 to 30,999.99
$9,833,583 vol
S&P price on Oct 22, 2026 at 10am EDT?
7,730 or above market icon
7,730 or above
7,755 or above market icon
7,755 or above
Oct 21 @ 8:00 PM
(Pyth Index.US30/USD) price on Oct 22, 2026 at 10am EDT
At least $52,725 market icon
At least $52,725
At least $52,800 market icon
At least $52,800
Oct 21 @ 8:00 PM
How low will the S&P get this year?
6,300 or below market icon
6,300 or below
6,000 or below market icon
6,000 or below
$1,858,766 vol
How high will the S&P get this year?
8,000 or above market icon
8,000 or above
8,200 or above market icon
8,200 or above
$2,025,108 vol
(Pyth Index.US30/USD) price on Oct 22, 2026 at 4pm EDT
At least $52,875 market icon
At least $52,875
At least $52,975 market icon
At least $52,975
Oct 21 @ 8:00 PM
Will the S&P finish positive this year?
$2,817,642 vol
Treasury spread 10Y-2Y by Dec 31, 2026
Above .7%
Above .8%
$18,806 vol
10Y US Treasury yield on Oct 23, 2026?
5.08% or above market icon
5.08% or above
5.14% or above market icon
5.14% or above
Oct 16 @ 7:30 PM
Will Bitcoin outperform gold in 2026?
$615,692 vol
NASDAQ-100 price at year-end?
30,000 or above
31,000 or above
$107,992 vol
How low will the 10-year US Treasury yield get by Oct 30, 2026?
5.05% or below
5.07% or below
$23,623 vol
30Y US Treasury yield on Oct 22, 2026?
5.4% or above market icon
5.4% or above
5.42% or above market icon
5.42% or above
Oct 21 @ 7:30 PM
IBOVESPA closing level on Oct 26, 2026
At least 212,000 points market icon
At least 212,000 points
At least 215,000 points market icon
At least 215,000 points
$1,176 vol
S&P price on Oct 22, 2026 at 4pm EDT?
7,745 or above market icon
7,745 or above
7,740 or above market icon
7,740 or above
Oct 21 @ 8:00 PM
How high will the Nasdaq-100 price get in 2026?
31,600 or above
32,000 or above
$326,925 vol
2Y US Treasury yield on Oct 22, 2026?
4.82% or above market icon
4.82% or above
4.88% or above market icon
4.88% or above
Oct 21 @ 7:30 PM
How high will the 2-year US Treasury yield get in Oct 2026?
4.94% or above
4.93% or above
$34,174 vol
How high will the 30-year US Treasury yield get by Oct 30, 2026?
5.67% or above
5.71% or above
$80,404 vol
Annual Return: S&P 500 Total Return Vs. Gold?
S&P 500 Total Return Index
Gold
$60,015 vol
5Y US Treasury yield on Oct 22, 2026?
5.01% or above market icon
5.01% or above
5.03% or above market icon
5.03% or above
Oct 21 @ 7:30 PM
2Y US Treasury yield on Oct 23, 2026?
4.85% or above market icon
4.85% or above
4.89% or above market icon
4.89% or above
Oct 16 @ 7:30 PM
How high will the 10Y US Treasury yield get by Oct 23, 2026?
5.16% or above market icon
5.16% or above
5.17% or above market icon
5.17% or above
$3,573 vol
7Y US Treasury yield on Oct 22, 2026?
5.04% or above market icon
5.04% or above
5.1% or above market icon
5.1% or above
Oct 21 @ 7:30 PM
S&P price at year-end?
7,800 or above
7,900 or above
$94,461 vol
10Y US Treasury yield at year-end?
5.1% or above
5.25% or above
$111,172 vol
How high will DXY get in 2026?
Above 103
Above 104
Jan 1 @ 3:00 AM
Annual Return: WTI vs. Brent?
Brent Crude Oil
WTI Crude Oil
$43,688 vol
How low will the 30-year US Treasury yield get by Oct 30, 2026?
5.41% or below
5.36% or below
$13,465 vol
Loading
Loading
Loading
Loading
Loading
Loading
Loading
Loading
Loading
Loading
Loading
Loading
Loading
Loading
Loading
Loading
Loading
Loading
Loading
Loading
Loading
Loading
Loading
Loading
Loading
Loading
Loading
Loading
Loading